Bitcoin vs. Global Assets
BTC Against Energy, Metals, Treasuries, Indices, Currencies, and Agricultural Assets
How does Bitcoin perform relative to a broad range of commodities and other global assets?
That’s the question we aim to answer today with our new chart: Bitcoin vs. Global Assets.
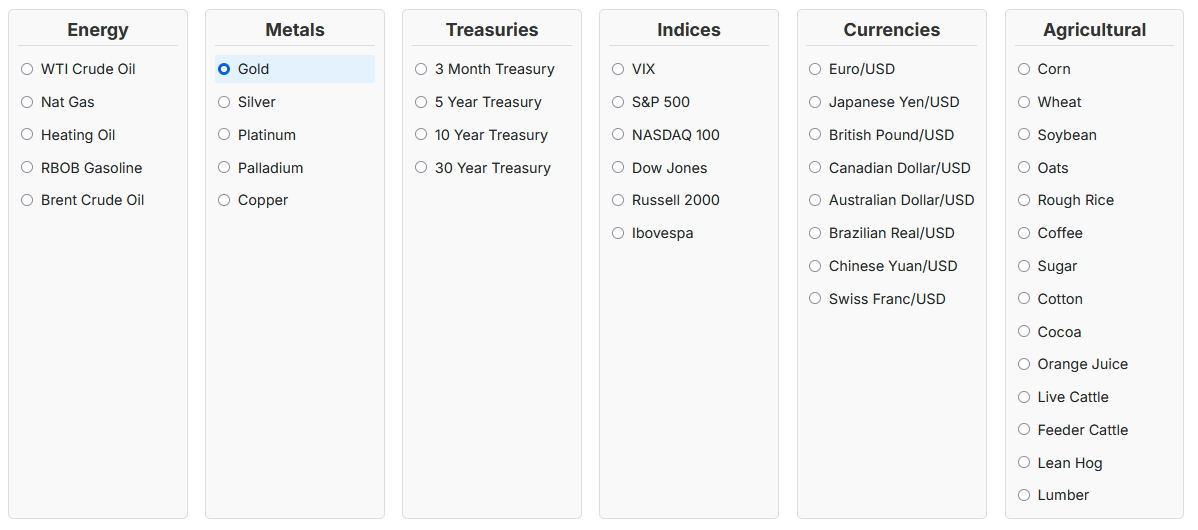
You can choose from 44 global assets to compare their performance against Bitcoin across the following categories: energy, precious metals, treasury yields, stock indices, currencies, and agricultural commodities.
You can also apply moving averages to the series by entering the period (in days) in the field below the chart. The percentage gains in USD for each asset are displayed at the top of the chart, reflecting the period shown on the screen (from the first to the last value).
For example, in the image below, WTI crude oil gained +20.76%, while BTC increased +689.74% over the same period.
You might even spot some curious (or spurious?) correlations, such as Bitcoin vs. cocoa or Bitcoin vs. coffee.
That’s all for today — have a great one!


