New Charts: The Bitcoin Price Normalized by Halvings and Historical Price (Since 2010!)
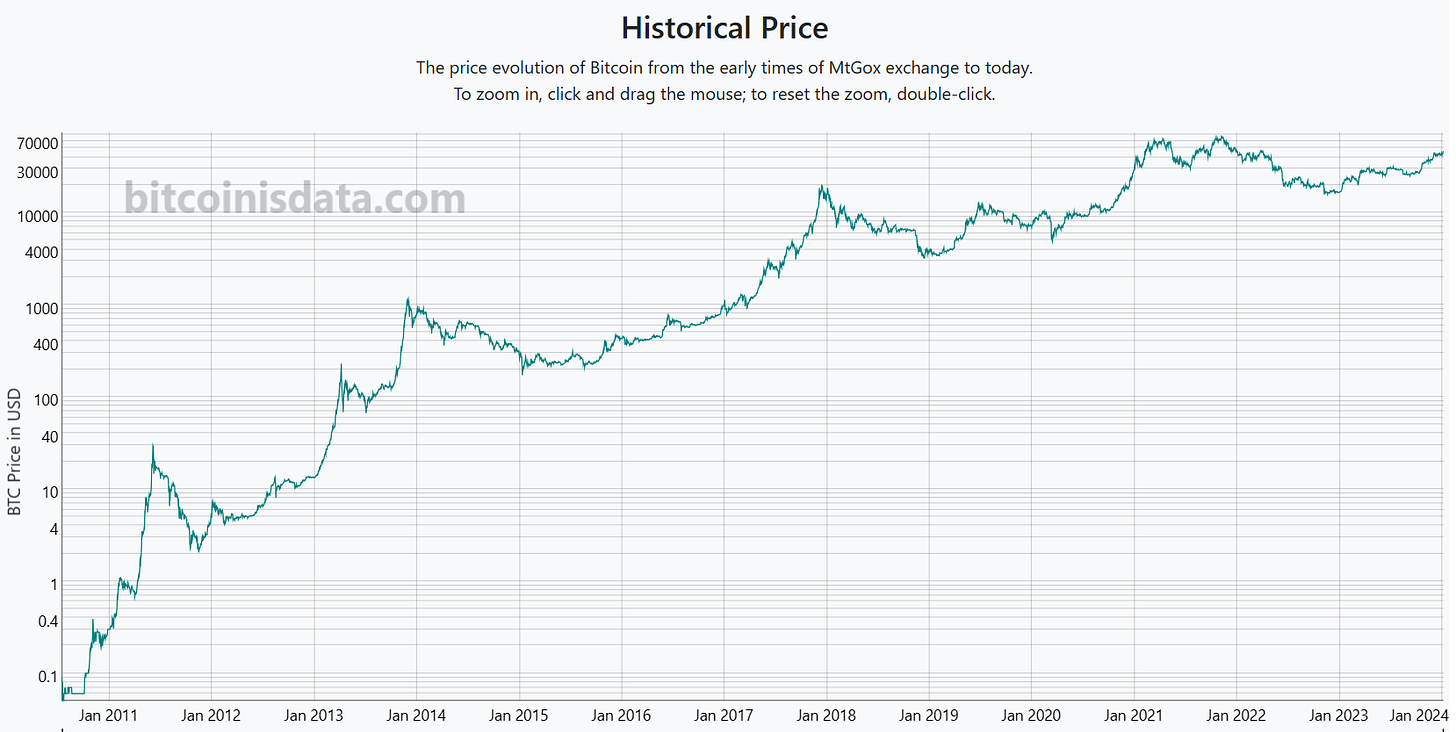
Historical price since the MtGox era, starting from 2010.
Today, we are releasing two new charts on Bitcoin Is Data:
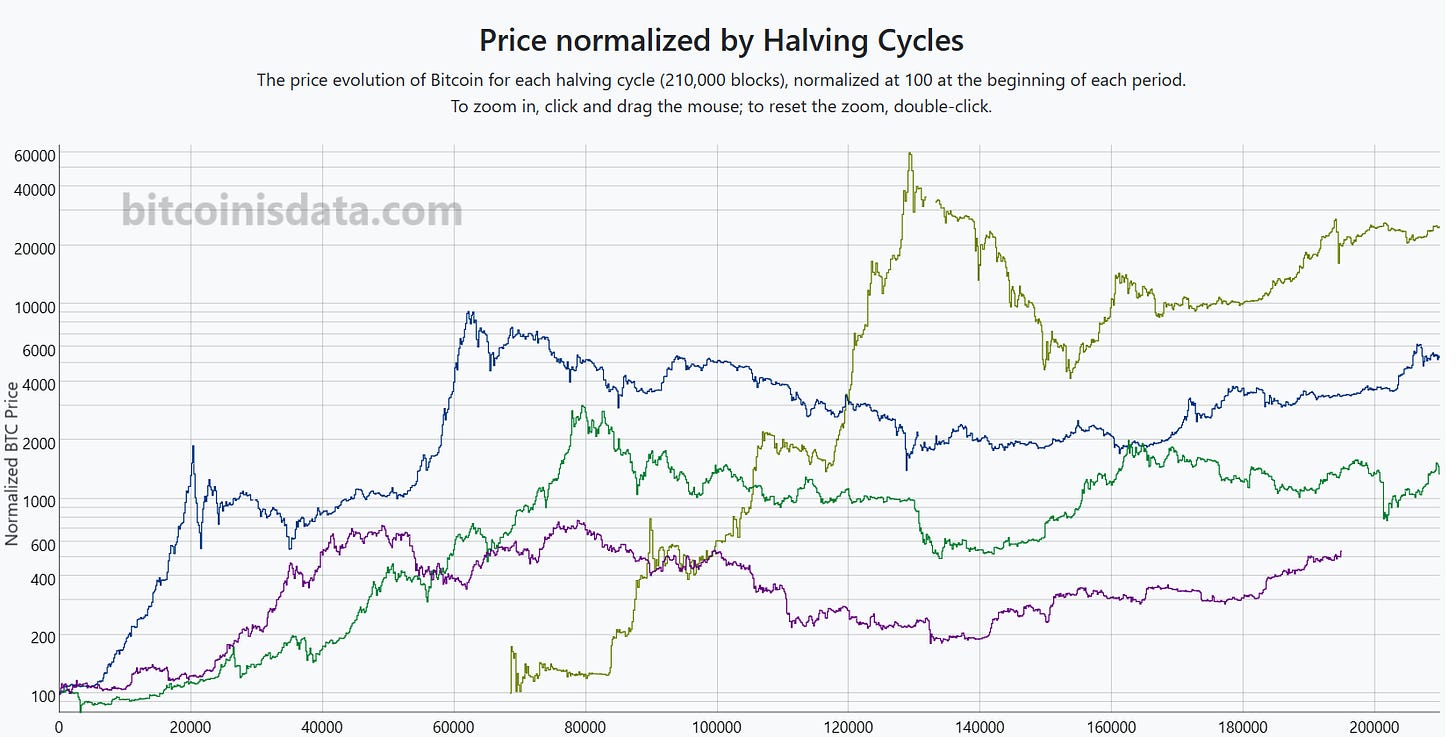
The first one is the Bitcoin price normalized to 100 at the beginning of each halving cycle, as shown below:
If the BTC price follows the pattern from previous cycles, we are in for a good ride in the coming months.
The second chart we have added displays the historical price, along with the bonus of having the earliest records of BTC trading from the MtGox era. If you want to access the raw data, please subscribe here.
That’s it for today, have a good one!
The Bitcoin Is Data team.


